The Rise and Fall
As I touched on in the last post, there has been a decline in registrations in Ontario lacrosse. The numbers, as we will see, are particularly worrying, yet the outward appearance of the OLA is one of ‘business as usual.’ I can only imagine the excited yammering at the AGM, followed by promises of a golden solution, followed by more of the same: small measures and token efforts. Followed by more decline. Bringing the idea of a band aid into the conversation may seem a little too cliché, but it is a metaphor that seems to fit. Perhaps we need a new metaphor to describe the dressing for something gangrenous. I jest of course.
Full disclosure: the numbers that I am going to rely on in this post are culled from only a few sources available to me today: a bar chart graphic once used for the Festival promotion, the MyLax site archives, and a document that was included with everyone’s AGM packet, showing the registration numbers for 2017 & 2018. I am also going to briefly refer to a tally of registrations for Oshawa Minor that I have been keeping and refer to a time when Whitby allegedly had 1400 registrations. I will discuss the reliability of the data after I have presented the sources.
In addition to these sources, I have also asked the OLA and CLA if they could supply me with current, up-to-date statistics based on overall numbers with breakdowns by sector (and province from the CLA). I think such a frank, public disclosure is in the best interests of the sport, from my perspective at least. However, I do understand the OLA and CLA’s reluctance to reveal the stats for many reasons, including a perceived hostility toward the organizations. That would be a false assumption of course – I don’t believe an organization is the sum of their executive or administrators, I believe it is the sum of its membership. Nevertheless, the numbers paint a picture bordering on catastrophe – if the OLA and CLA have better numbers, I am willing to make corrections or retractions.
Festival Chart
This chart, linked from the Ontario Lacrosse Festival homepage, shows the registration statistics from 1990 to 2012. I have not located a version showing more recent registration stats and it seems the link to this chart is discontinued after the 2014 Festival.
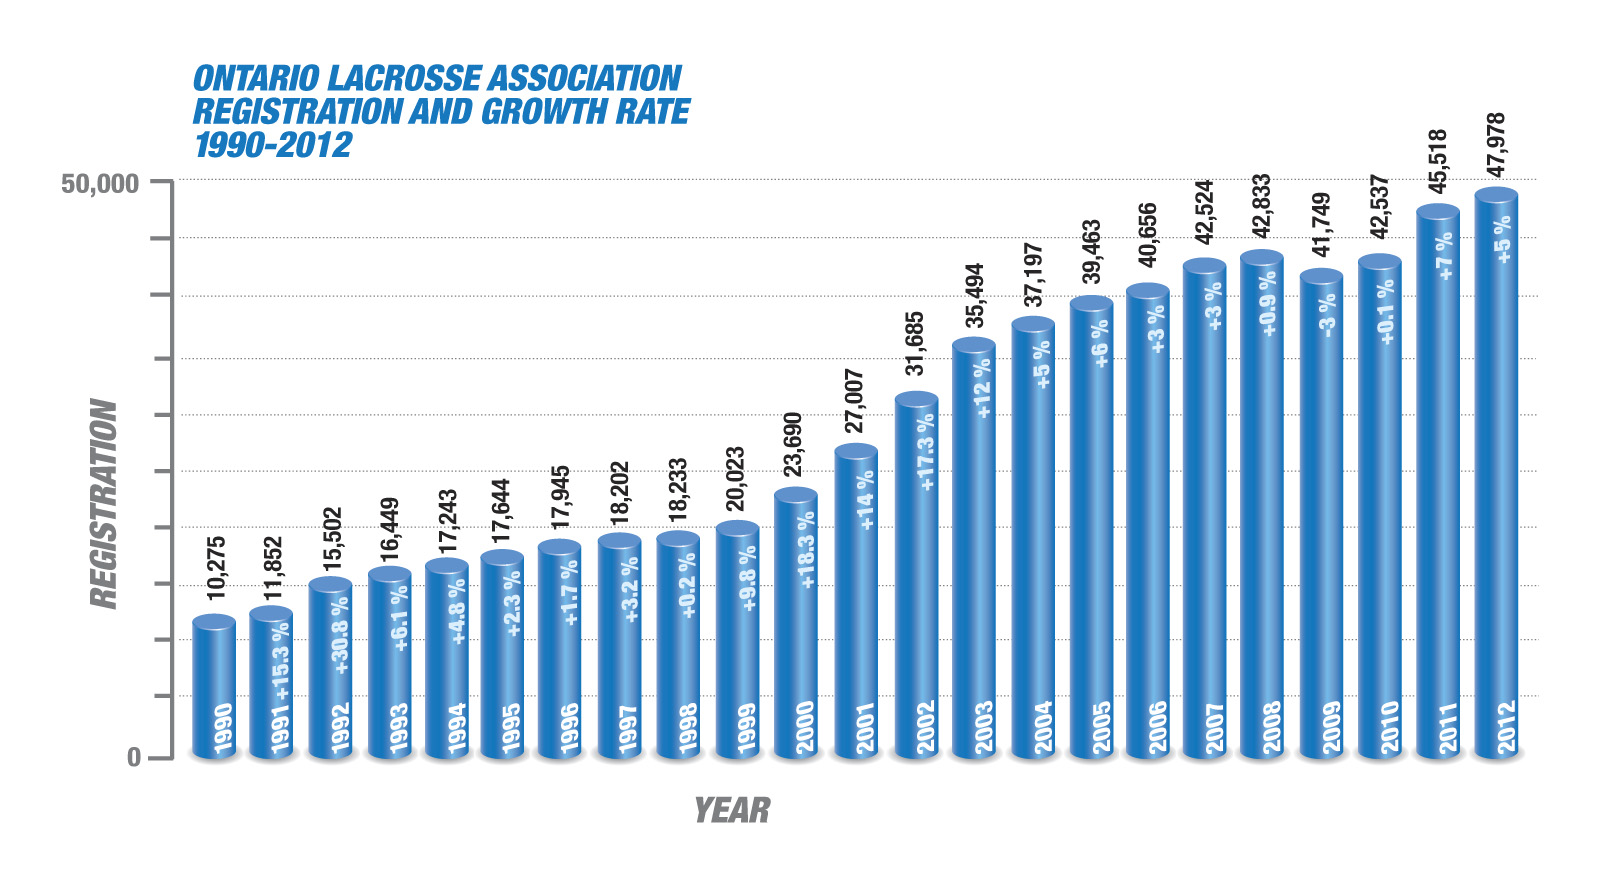
The chart shows the phenomenal growth of the OLA, as evidenced by registration numbers, over a 23 year period. The registrations double from 1990 to 2000, and double again from 2000 to 2012. This represents a sum increase of almost 367% over the whole period, from 10,275 registrations to 47,978. For the years 2000, 2001, and 2002, the numbers increased 14%, 17.3%, and 12% each year before tapering off to modest gains during the rest of the decade, until the first decline of 3% is noticed in 2009, with more gains for the remaining 3 years.
No doubt, these numbers were very heartening to lacrosse enthusiasts, especially administrators, as it was a period of expansion and seemingly unlimited growth. However, the chart inexplicably ends in 2012 and there are no other explanations as to why this growth chart wasn’t continued. There is no link or mention of it in the 2013 Festival materials – as they currently appear on the archived Festival sites.
My Lax Archives
To fill the gap between 2012 and 2018, I checked the My Lax archives, which contain the team listing for all rep box lacrosse teams in a given year since 2012. The numbers for boys’ teams are unremarkable and actually show modest growth in the numbers of rep teams over the 7 year period. The biggest changes show in the Paperweight and Midget categories, but again, small changes overall. The numbers of girls’ teams shows growth overall as well. Both sectors indicate the sort of growth one would expect to following from the upward trend showing from the Festival chart. This is important to keep in mind.
AGM Handout
This is a paper document that was included in the 2018 AGM packet. It appears to be a print of a spreadsheet page listing all minor associations (MA) organized by Zone. Next to each MA are two columns of information, the registration numbers for 2017 and the same for 2018. MAs that had an increase in registration are highlighted in yellow. There are also tallies for each Zone.
The data here does not show much of a net loss in registrations: in 2017, there were 18,753 registrants and, in 2018, there were 18,506. This is only a loss of 247 registrations, a mere 1.32% loss.
Of the MA’s that gained numbers, the increases were generally small, except for a few that had significant increases such as West Durham, Beaches, Windsor, Burlington, and Orangeville. With the exception of Zones 5 & 8, all Zones were down numbers. If we exclude the 241 registrations that came along with the two Quebec MAs (North Shore, South Shore), Zone 5 goes from a 10% increase to an actual 11% loss.
Local Minor
In 2011, Oshawa Minor started their inaugural season with a bit more than 600 registrations. Some of those players were previously registered with Whitby and Clarington, but if I recall correctly more than half of those registrations were new players. A good omen for lacrosse in Oshawa!
I have kept track of the registration numbers for Oshawa Minor over the years and while there was a small trend downward in the years following the start of the club, it picked up significantly to the point where the club is currently approaching half of its former registration, if it hasn’t reached that distinction already.
In 2011, despite some players moving over to Oshawa, Whitby Minor was experiencing unprecedented growth, inching toward 1400 registrations. This resulted in up to 4 rep teams in each age category and a vibrant house league.
Data Issues
If we compare the Festival Chart with the AGM handout, we see a huge decline in the numbers from 2012, where the Festival chart leaves off, to 2017 registration numbers as presented in the handout. The OLA went from 47,978 registrations to 18,753; a difference of 29,255 or a decline of just over 60%. This is an alarming drop in numbers! For now, however, we’ll presume the data is flawed.
If there is a problem with the numbers in the Festival Chart and the AGM handout, I suspect they both suffer from the same cause: the need to ‘massage’ the numbers and make them look better than they really are. There is no primary source listed for the Festival chart, nor any indication as to how those numbers were calculated. Do they include all sectors of lacrosse? Do they represent a single person, or the same person registering across several sectors of lacrosse? Boys’ box and field used to require separate registration forms, is each rep participant counted twice?
It would not be surprising that the Festival numbers were worked in such a way as to be more attractive to sponsors and funders. It says “registrations” after all, not participants or players. It likely includes anyone and everyone involved in lacrosse as well, including administrators, coaches, etc.; it may include try-out registrations for junior teams, for example, or registrations for winter programs. There is no way to know without insider information as to the nature of how these numbers were compiled.
Interestingly enough, if we halve the numbers in the Festival chart, they fall in line with the numbers from the AGM handout and show a smaller 5-year percentage decrease, from 23,989 in 2012 to 18,753 in 2017. This is a much less catastrophic decrease than 60%! Except for one thing: the numbers I have been following with regards to Oshawa and Whitby minor and to a smaller degree Clarington, which all show significant decrease in membership, more in line with 35% – 40% decreases. So what gives?
What If…?
Data problems aside, there are two main intrigues at play: the first, as alluded to above, deals with deception and, depending on how you look at it, fraud. The second deals with a disastrous downturn of participation, which has very real financial and social implications for local MAs.
What if the numbers in the Festival chart were cooked up, intentionally inflated in order to deceive people. It does say registrations, not participants, that part is clear. However, even at a glance the chart impresses that those numbers refer to numbers of participants. This might easily be assumed by a potential sponsor or a person overlooking funding applications. Maybe inflating numbers in this way are a standard practice, but even still, in retrospect, compared to the current numbers from the AGM handout, it looks like the OLA is a sinking ship or lacrosse is in worse shape than anyone in the OLA is going to admit. That part doesn’t look like good for sponsors or funders. You would think there would be some sort of mitigation of this chart, other than burying it in the archive sites for the previous years Festivals.
Interestingly enough, the reason I would believe that numbers like this could be cooked up is because of the numbers I collected for Oshawa minor don’t match up with the numbers for Oshawa minor listed on the AGM handout. They are not even close. However, if one adds the registrations from the winter program they run, the numbers come into range. It might make sense that the registration numbers for the winter program are added to the registration numbers for the field and box season. Except that would mean players were counted twice, including any out of town players for the winter program. This all means that if the registration numbers in the AGM handout are also cooked and massaged, things are far worse than they appear. Whitby is showing 642 registrations in 2018, more than 50% decline from their 1,400+ peak. This suggests that if OLA registrations are down this significantly, the registration decline in Oshawa and Whitby tend to reflect that drop as evidenced by the 2012 & 2018 numbers.
What if accuracy wasn’t required in any of these accounting schemes? They were never meant to make sense in the first place. Only mean-spirited bloggers care. Which brings up the My Lax site. A year-to-year comparison shows that the number of rep teams has remained fairly stable over the period that My Lax has been in operation. There have been small gains and losses over the years, but it all works out to be about the same as it always is. Good news for the OLA because the income from rep remains about the same, what with all those team and player fees coming in. Ka-ching.
Perhaps the only time the OLA gets worried is when their bottom line is affected. This is not as cynical as it sounds. Given the lacklustre performance on addressing the downturn in participation in OLA lacrosse – whether we are talking mere thousands or tens of thousands – it makes perfect sense. Seeing that growing the game is, essentially, a local initiative, the OLA can hardly be blamed for a hands-off approach or, worse, sitting back and doing nothing. Besides, can the OLA even react effectively enough to provide a solution to a problem that most of the administrators have never experienced during their OLA career? That, to me, seems to be the heart of the problem: you can’t solve a problem with the same thinking that caused it.
There was a time when you could walk into McKinney multiplex arena on any weekday night and the place was booked full, house league games in both rinks, throngs of sweaty players leaving with their parents, eager and excited throngs coming in for the next games. It was a boisterous, thriving place, cheers coming from stands, laughter, smiling faces. All for the pure love of the game for the game’s sake.
Now Whitby has to post this on their website: “Divisions are subject to sufficient enrollments.”
That’s sad.
Next: Race to the Bottom
